"Uncapped" is the holy grail for borrowers but not so much for lenders
Highlights
- Cost savings add-back prevalence ranged from 20% to 55% of deals over nine quarters, with no consistent pattern.
- Uncapped add-backs nearly disappeared, falling from 20% of add-back deals in Q3 2023 to 0% in Q3 2024.
- Generous caps and long look-forward periods still give borrowers real flexibility even without going uncapped.
By Dan Wertman, originally published on the Noetica blog, now part of Thomson Reuters. October 2024, April 2025, and June 2025.
Companies are increasingly becoming the best magicians on the planet — and lenders are caught watching an illusion nobody’s talking about.
Jump to ↓
What these terms let borrowers do
A volatile two years, in one chart
The fine print: caps and look-forward periods

What these terms let borrowers do
Cost savings EBITDA add-backs let borrowers add projected, not-yet-realized cost savings and synergies into their EBITDA calculation for covenant purposes. That flexibility can increase a borrower’s ability to incur priming debt, move assets from the credit group via dividends or asset transfers, or even avoid an event of default under a financial covenant — all without those savings ever actually materializing.
A volatile two years, in one chart
Noetica’s Q1 2025 data reveals a striking story. EBITDA add-backs were in 55% of deals in Q4 2024 — the highest rate in two years — before falling to 37% in Q1 2025, an 18-point drop. Uncapped add-backs fell even further over the same stretch, from 20% down to 9%.
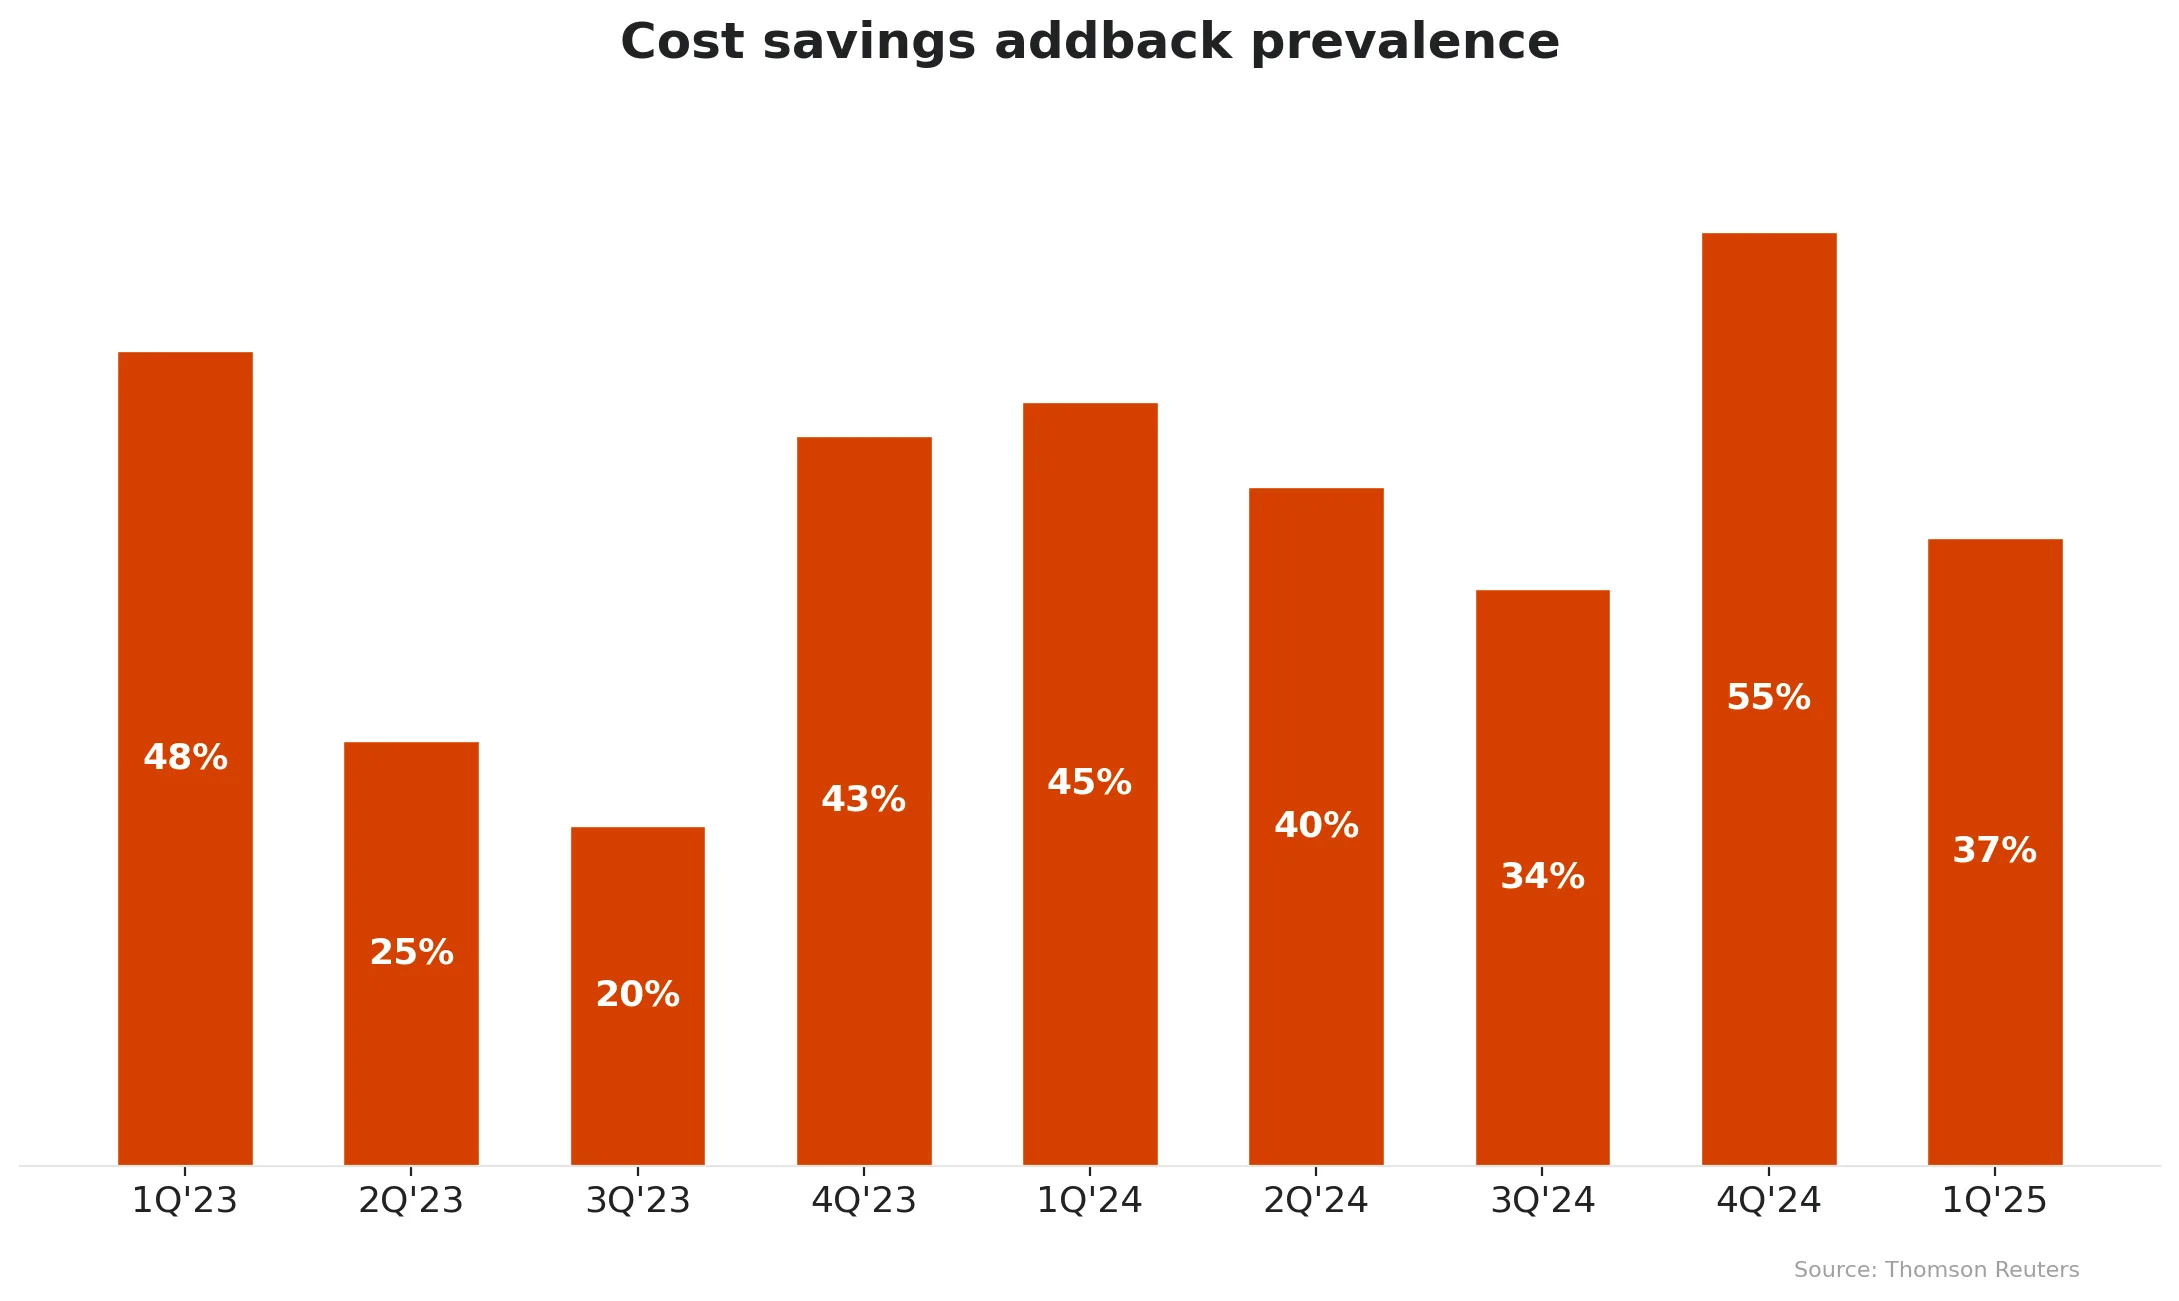
Most striking is the sheer unpredictability. Over nine quarters, these terms have ranged from 20% to 55% with no consistent pattern where one quarter’s impossible ask becomes the next quarter’s market standard. With these terms directly impacting borrowing capacity headroom, catching the market at the right moment can mean millions in additional flexibility.
The fine print: caps and look-forward periods
The headline prevalence rate only tells part of the story. While uncapped add-backs remain rare, high caps and long look-forward periods still provide significant flexibility for borrowers who don’t get an uncapped provision.
In the third quarter of 2024, 34% of publicly filed high-yield credit agreements permitted cost savings-based add-backs to EBITDA, compared to only 20% in the same period of 2023. Of the deals allowing such add-backs, none permitted uncapped amounts in Q3 2024, compared to 3% in Q3 2023.
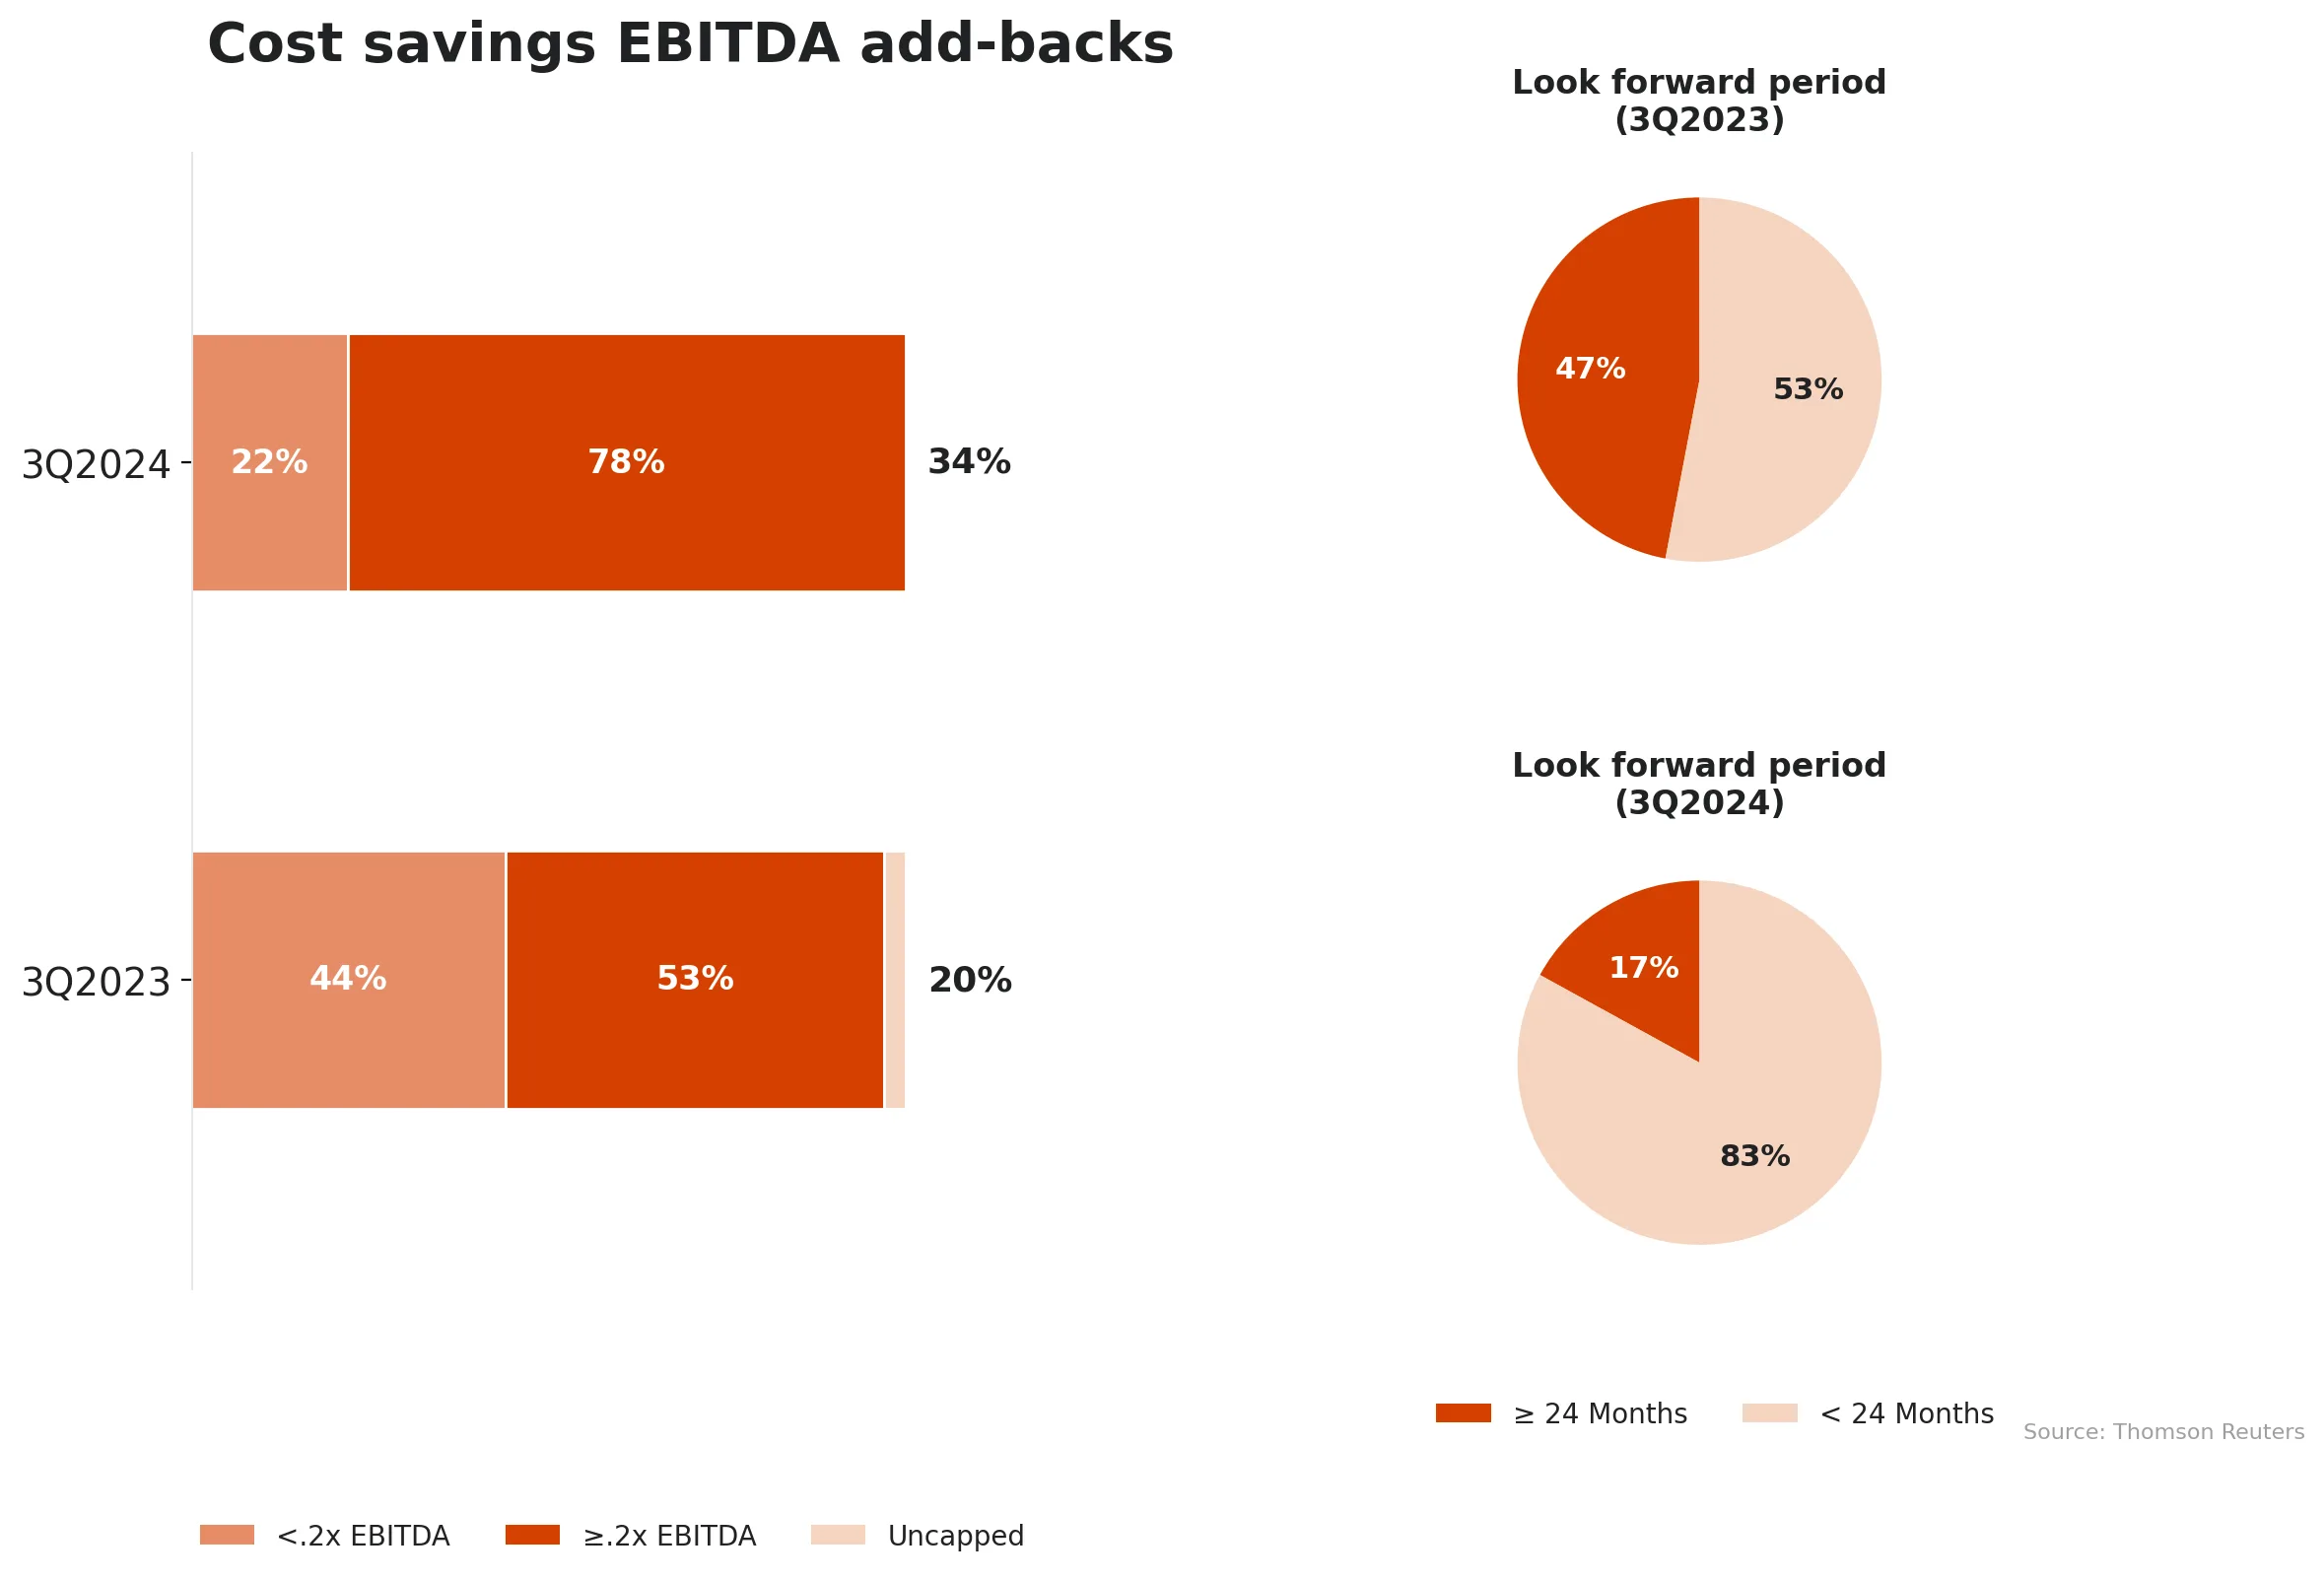
However, 78% of Q3 2024 deals permitting cost savings add-backs included caps equal to or greater than 20% of EBITDA, compared to 53% in Q3 2023 — meaning the caps that remain have gotten more generous even as uncapped provisions disappeared. Look-forward periods moved the opposite direction: only 17% of Q3 2024 deals included a look-forward period of 24 months or longer, down sharply from 47% in Q3 2023.
Could tariffs be next?
The 2025 tariff swings raised a question worth asking: why shouldn’t borrowers get to add back tariffs the same way? In a world where a borrower’s cost of goods sold can increase 100%+ overnight due to non-operational factors like tariffs — ephemeral, uncertain, and unpredictably large — lenders already functionally agree to similar logic for tax add-backs (excise, franchise, income, capital gains), on the theory that policy matters shouldn’t drive credit assessments.
The idea isn’t hypothetical. In 2018, in response to the first wave of tariffs, Motorcar Parts of America included “amounts in connection with tariff costs incurred in excess of price increases” as an EBITDA add-back in its credit deal, capped at $5 million.
That specific add-back is present in under 1% of credit terms today, but given how quickly cost savings add-back terms have moved in just the past two years, a tariff-specific add-back becoming market standard wouldn’t be a surprising next chapter.
For more deal-term benchmarking like this, explore the latest Capital Markets Radar Report from Noetica, now part of Thomson Reuters.